Spectral Fireworks. Featured Image Credit: NASA/Johns Hopkins University Applied Physics Laboratory/Carnegie Institution of Washington
Introduction
Similar to spectroheliographs, there are many other devices with the ‘spectro’-prefix (coming from the word ‘spectrum’) that have similar functionality but different names. Here, we first explain how they are different from one another and their uses with solar eclipses.
Spectroscope
A spectroscope breaks down radiation making the ‘spectrum’ visible for the observer. Early versions had a slit, a prism, and a screen with markings to indicate various wavelengths or frequencies; later versions were calibrated to electronic detectors. Although the apparatus Isaac Newton used in his work on the spectrum of light can be considered a crude spectroscope, it is generally recognised that the spectroscope was invented by Gustav Kirchhoff and Robert Bunsen around 1860.
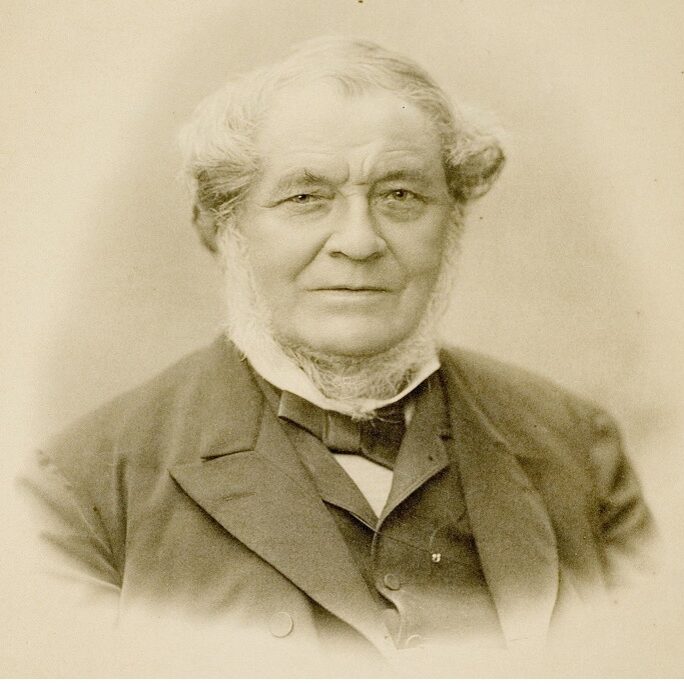
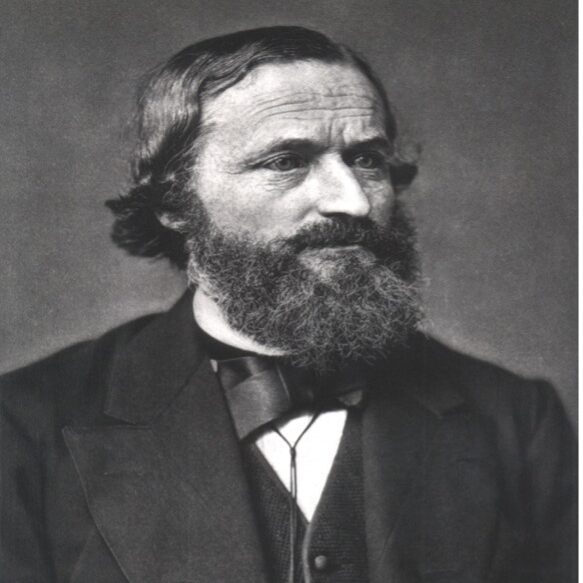
Examples of usage
In the late 1870s, Norman Lockeyer worked a great deal on designing and modifying spectroscopes and their techniques. This was to make them suitable for making observations during eclipses, thereby providing a spectrum of the eclipsed Sun. The spectroscopic equipment and techniques have since been used extensively in the spectroscopy of lunar eclipses, and has been suggested as an experiment with the James Webb Space Telescope (JWST) in relation to eclipse spectroscopy.
Spectrometer
A spectrometer is any instrument used to probe a property of light as a function of its portion of the electromagnetic spectrum – typically its wavelength. Usually the light intensity is measured, but a spectrometer can be used to measure other variables like light polarisation. Spectrometers provide information on whether a certain substance is present, and how much of it was measured, which overcomes a major limitation of the spectroscope. Technically, a spectrometer can function over any range of light, but most operate within a particular region of the electromagnetic spectrum.
Spectrograph
A spectrograph is an instrument that separates incoming light by its wavelength or frequency. It records the resulting spectrum in a multichannel detector, such as a photographic plate. Many telescopes used for astronomical observations essentially operate as spectrographs.
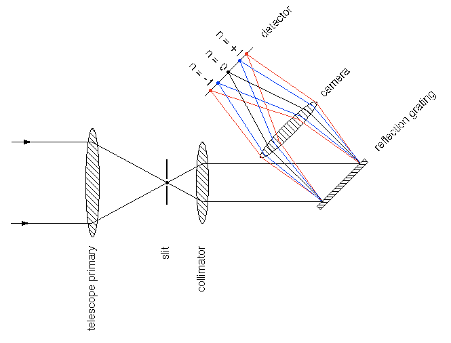
Examples of usage
Spectroscopy was used in the NCAR (National Center for Atmospheric Research) High Altitude Observatory eclipse experiments to collect large amounts of data on the solar corona and chromospheres, as well as studying the exploration of exoplanets.
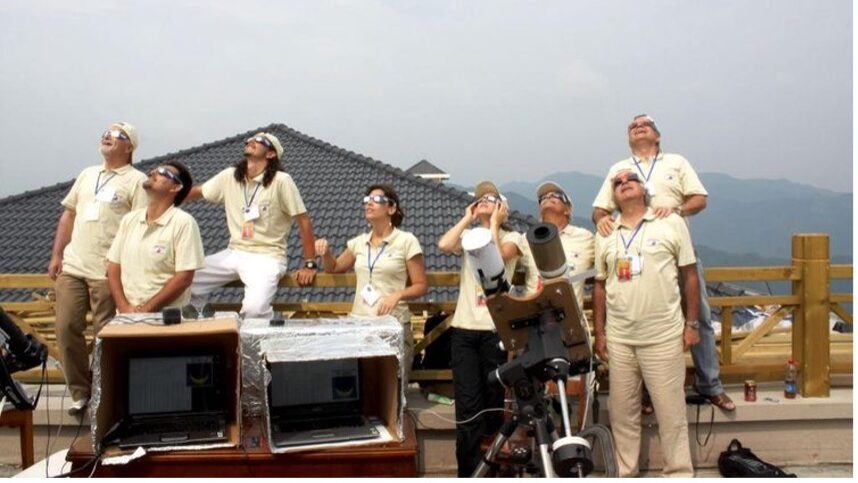
Spectroscopy has even been used in amateur scientific expeditions for safely ‘viewing’ and monitoring irradiance of total solar eclipses, as the technique can even capture the irradiance not visible to the naked eye, and do so in crystal clear detail!
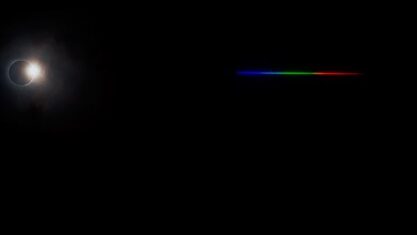
A Greek team comprised of scientists and students from the Aristotle University of Thessaloniki were able to make spectrographic measurements of the different stages of an eclipse, such as the spectrum for the “diamond ring” (shown in the photo on the right, below), even though the viewing conditions were sub-optimal. The diamond ring effect occurs when totality is just beginning or ending (i.e. when the Moon just begins or finishes fully covering the Sun). Sunlight bursts through prominent valleys or craters along the limb of the Moon, producing a brilliant “diamond” on the brightened ring of the lunar silhouette.
Further reading
Silicann Systems GmbH, THE DIFFERENCE BETWEEN SPECTROSCOPE, SPECTROMETER AND SPECTROPHOTOMETER (2020), (Accessed: 30th June 2023)
D. W. Ball, Field Guide to Spectroscopy (2006), SPIE Press, Bellingham, WA, (Accessed: 30th June 2023)
Heidelberg University, Robert Wilhelm Bunsen, 1852–1889 Professor für Chemie in Heidelberg (1852-1899), Accessed: 30th June 2023)
Portrait of Gustav Kirchhoff, Smithsonian libraries (SIL-SIL14-k002-03 (19th Century), Gustav Robert Kirchhoff, (Accessed: 30thJune 2023)
Lockyer, J. An Eclipse Spectroscope. Nature 18, 224–225 (1878), (Accessed: 30th June 2023)
Strassmeier, K.G., Ilyin, I., Keles, E., Mallonn, M., Järvinen, A., Weber, M., Mackebrandt, F. and Hill, J.M., 2020. High-resolution spectroscopy and spectropolarimetry of the total lunar eclipse January 2019. Astronomy & Astrophysics, 635, p.A156. (Accessed: 30th June 2023)
Vik Dhillon (2013), Basic Spectrograph design, (Accessed: 30 June 2023)
AZO Materials, Using Spectroscopy for Solar Applications, Avantes BV, (Accessed: 30th June 2023)
General Microtechnology and Photonics (2017), Spectral Analysis of the Total Solar Eclipse. (Accessed: 30th June 2023)
Universities Space Research Association (2009), Solar Eclipse Spectrograph, Tilemachos Athanasiadis. (Accessed: 30th June 2023)